A membership nonprofit’s scattered data, in one place the staff can use.
A small team, thousands of members across the country, and four years of data nobody could read in one view. I fixed that, and taught Claude what the data means.
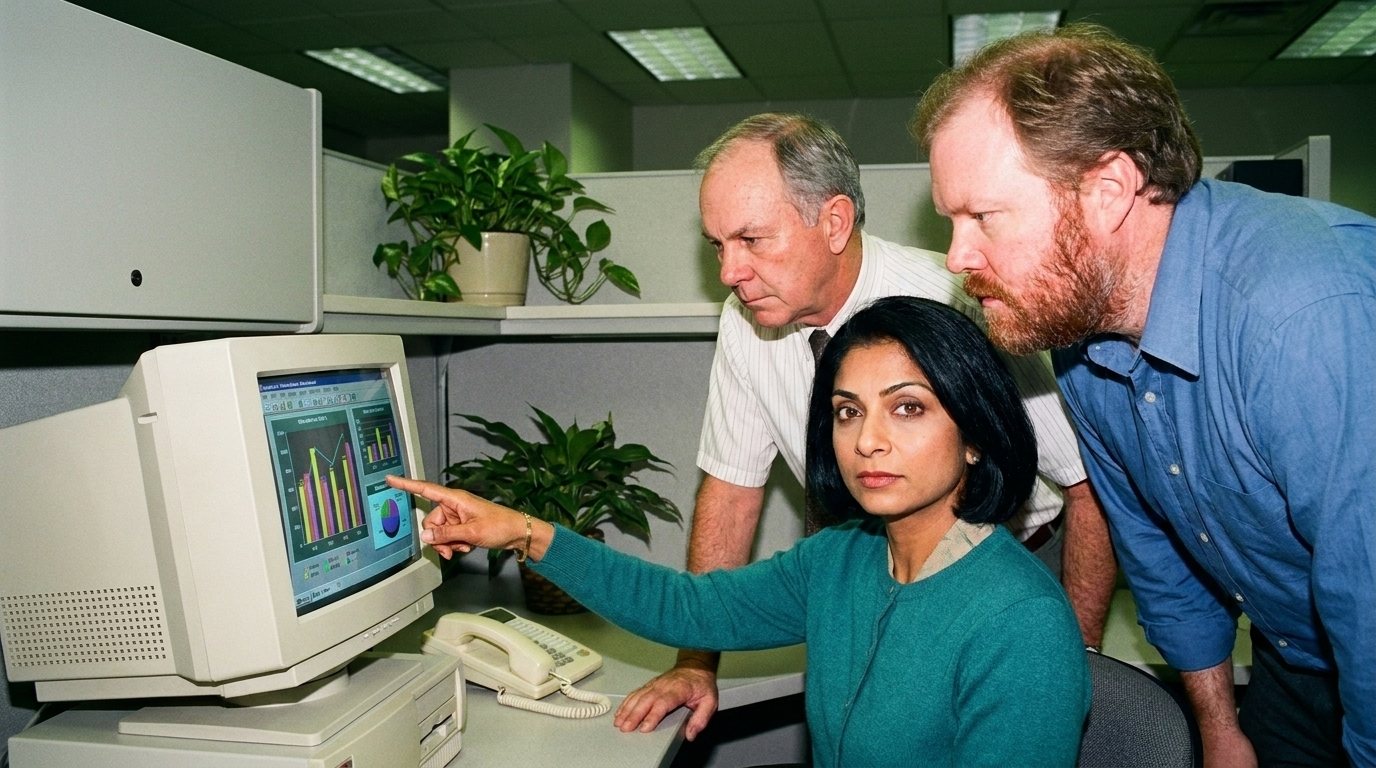
Too many moving parts for a small staff.
This nonprofit has members in every state, and membership has been moving in the opposite direction it used to as the culture around it changes. They have a lot happening at once:
- Events in different cities and states
- Several kinds of membership, with talk of consolidating them
- Annual and monthly members, with renewals and cancellations
- Social media campaigns and Meta ads
- Website traffic and monthly users
- An aging CRM sitting in the middle of all of it
The goal was to free the staff to do the human work: enrolling people and reaching out to them.
Three steps.
Pull it all into one place
Website, social, ads, membership and event data, going back four years, brought together instead of living in separate tools.
Teach Claude what it means
What does each column mean? What counts as a member? How do these things connect? I wrote that down, so the AI reading the data understands the organization.
Turn it into answers
Dashboards for the team, plus the ability to ask questions and get answers on demand, and to see what the data predicts.
From scattered sources to answers.
Intelligence on demand, for a nonprofit.
- Data on demand. The team can ask a question and get an answer instead of building a report.
- New angles. Claude can correlate across systems and show overlaps nobody had connected before.
- Predictions. It points at outcomes to expect and the places the staff should be looking.
- Time back. Less time inside spreadsheets, more time with members.
It’s the same idea Palantir uses for governments and giant companies, scaled to a nonprofit’s budget. Read how it works.
I don’t name clients or show their data.
Nothing on this page identifies the organization. Want something like this for yours? The first five clients pay $250.